
Last year I challenged myself in a way that I had never done before. I’m used to setting goals, but I’ve never pushed myself physically. Before last year, I had never run farther than 3.5 miles. I’ve run 5K races before, but nothing beyond that.
Last year was different. I decided to run a 5K, a 10K, and a half marathon.
When I signed up for the half marathon, I had no idea how I was going to run 13.1 miles. It seemed unapproachable, but I signed up anyway. It took months of training, but I did it.
I accomplished what I set out to do. I completed all three races. My medals now hang in our entryway. They serve as a reminder to myself that I can accomplish big goals.
I would love to show you a picture of these medals. But the medals hang from a board with my last name etched into it, and we are still anonymous. So you’ll have to take my word for it.
What I enjoy about running more than other sport is that you run your own race. There were thousands of other athletes running alongside me in the half marathon. I wasn’t competing against anyone of them, nor were they competing against me.
My goal wasn’t to stand on a podium or beat a certain number of runners in my age group. I ran my own race.
I find this to be a perfect analogy for personal finance, especially the journey to financial independence.
Too often people compare themselves to the average person to gauge their financial progress. I’ve been guilty of it at times as well. I was recently researching the average savings in the U.S. I was curious about average savings. Subconsciously, it was also a way to pat myself on the back for our high savings rate. I soon realized that this was a bit foolish.
I would never run a race with the goal of being average or finishing before half of the participants and after the other half of the participants. Why would anyone do this?
It’s time that we put an end to this practice. If you are looking to figure out how much money to save, please don’t start with this question: what does the average American save?
Average Savings for Americans
I’ve spent some time researching information on the average savings for Americans. There are many ways to look at this data. This includes a couple of different ways to interpret “savings” (savings rate vs net worth).
Before I can share why comparing yourself to the average is not helpful, it’s important to provide a summary of the savings data available. Below are some of the highlights from my research on average savings.
1. Only 55% of American households actually saved money in 2016. This has been very similar for the prior 15 years, as shown in the chart below.

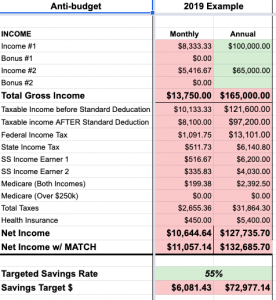
2. According to the Bureau of Economic Analysis (BEA), the average American household saves about 8% of their disposable income. This aligns with my back-of-the-napkin math of a 6-7% savings rate that I calculated using the U.S. Bureau of Labor Statistics data. I referenced in this data in a post I wrote about pursuing FI in a high cost of living area, but have now added in taxes (using our tax rate in MA as a sample). The formulas in the Anti-Budget spreadsheet template made this calculation easy.
| Gross Income (before Taxes) | $74,664 |
| Taxes (estimate) | $13,889 |
| Net Income | $60,775 |
| Total Expenses | $57,311 |
| Savings | $3,464 |
| Savings Rate (estimate) | 6% |
3. Everyone can save, regardless of age. The percentage of families that saved money is similar across all age groups. There isn’t one age group that has a significantly higher proportion that saves than any other group.
| Age of head (years) | % of Families that Saved |
|---|---|
| Less than 35 | 56.7% |
| 35-44 | 56% |
| 45-54 | 55.1% |
| 55-64 | 55% |
| 65-74 | 54.3% |
| 75+ | 53.5% |
4. Retirement is NOT the most popular reason why families save money. Liquidity (having an emergency fund or cash on hand) is the most popular, with retirement a close second.
| Reason for Saving | Percent |
|---|---|
| Education | 7.2% |
| For the family | 6.9% |
| Buying own home | 4.1% |
| Purchases | 12.1% |
| Retirement | 30.3% |
| Liquidity | 36.2% |
| Investments | 1.8% |
| No particular reason | 0.6% |
| When asked for a reason, reported do not save | 0.8% |
| Total | 100% |
5. The average savings or net worth by age looks like this table below. As you can see, the average net worth is skewed by the ultra-wealthy individuals. The median net worth gives a more realistic view of the distribution of wealth.
| Age of head (years) | Median Net Worth | Average Net Worth |
|---|---|---|
| Less than 35 | $11,000 | $76,200 |
| 35–44 | $59,700 | $288,200 |
| 45–54 | $124,000 | $724,100 |
| 55–64 | $187,300 | $1,164,400 |
| 65–74 | $224,000 | $1,058,900 |
| 75 or more | $264,800 | $1,064,700 |
Why You Shouldn’t Compare Your Savings to the “Average American”
While I find these stats and highlights very interesting, these are not that helpful for determining what you can and should save.
1. The average savings for Americans is so low that it is not helpful. This is true for both the savings rate and net worth.
The average savings rate is 8%. If you are still accumulating wealth (i.e. not already Coast FI), this savings rate enables you to work toward financial freedom at a slow pace. According to the chart in our savings rate post, you wouldn’t reach financial independence until you’ve worked for at least 51 years. That means even if you start working at age 18, you’d need to continue working until your late 60s or early 70s.
The need to work 50+ years based on your savings rate is consistent with what we see on the median net worth by age. Those entering the traditional retirement age (mid-60s) have saved a median average of $224,000, according to the table above. These savings would only support about $9,000 of annual expenses for the rest of a traditional retiree’s life. Many need to supplement their retirement with social security and active income.
If you are on the path to financial independence, like we are, continuing to compare yourself to the average savings rate is not helpful.
It would be like trying to compete in Major League Baseball and comparing your statistics to a pick-up slow-pitch softball team. The numbers would be in the same format, so it’s not a matter of apples and oranges per se, but the comparison is not helpful or meaningful.
And to be clear, the point is not to shame those with a lower savings rate. It’s just to make the point that each individual has their own goals, situation, and context. Comparisons are not meaningful.
Don’t use average savings as a measuring tool either encourage or discourage you, because this will not be helpful in any situation.
This brings me to my next reason.
2. Every family situation and lifestyle is different, and the “Average American” is a myth.
There is no such thing as the average American. Conceptually, any average tries to provide a way to describe a large variety of individual units. It’s a way to simplify or summarize a large group of individual items, whether they be numbers or people. But when applied to people or households, it suggests that there is a typical American that can represent the group.
I find trying to depict the average American is as difficult as trying to define or achieve the American Dream. The American Dream is often depicted as a family with 2.3 children, a home with a white picket fence, a dog and a cat.

While Jess and I do have a white picket fence (it came with the house), it’s literally impossible to have 2.3 children. In the same way, this concept of an average American is nothing more than a ghost. It’s not an actual person or group of people.
The approach of comparing one person or family to the average of the group is a questionable practice. Going back to my running analogy, why would anyone use this as a benchmark?
3. Averages tell you nothing about your goals or your progress toward them
Instead of comparing ourselves to the average, it’s better to determine what it is you want to get out of life.
Stephen Covey, in his book 7 Habits of Highly Effective People talks about beginning with the end in mind. Once you know what life you would like to live, work backward from there. Identify what you need to save to support the life that you want to live. Then set individual goals and track your progress against those goals.
The only way to track your success is to measure it against goals specific to your situation. If you’re on the journey to financial independence, you will want to set goals for yourself.
Everyone’s aspirations and situation are different. What you value most will help determine your next steps.
Ignore the rest of the noise, including the “average American.” Focus on your journey and the steps you need to take to get to where you want to be.
How We are Saving Money at Our Own Pace
For us personally, it has taken us many years to find the right pace of saving money. For a while, I struggled with wanting to save as much as possible. It felt like I could always do more to reduce our spending or increase our expenses.
There was never a sense of accomplishment or contentment. I now understand that this was driven by not knowing where we were going.
Over the past two years, we’ve gotten more clarity around what we want our journey to look like. That clarity has helped inform our next steps. With a better understanding of our destination, we’ve been able to create a path to get there.
One of our main goals is to gain more independence without sacrificing happiness now.
We are still saving aggressively in this wealth accumulation and passive income generation phase to buy our freedom. Those who read our blog regularly know that this pace equates to a savings rate of about 55-60% of our post-tax income right now.
The goal of making the journey enjoyable also means not saving as much as we possibly can so that we can enjoy life now. We could save more, but we are choosing not to. And I finally have peace of mind knowing that our journey aligns with our destination.
I’m no longer second-guessing our pace or wondering if we are saving enough or too much. I no longer need to compare ourselves to the average savings numbers or other people pursuing FI.
This is our sweet spot.
Our income, everyday expenses, and lifestyle factor into this pace. This is what works for us, but we know that it won’t be the same for everyone.
Your journey and pace will vary depending on your short and long-term goals and your capacity to save (income, fixed expenses, debt, etc.). As long as you are creating steps that will get you to your destination at your own speed, you don’t need to focus on external validation.


You’re saving 55-60% of your post-tax income. That’s huge. At that point, it’s better to focus on living an enjoyable life. Saving more isn’t going to make a big difference. You made a really good point with having the destination in mind. That’s probably why most people don’t save enough. They can’t picture the destination.
Great job with the marathon.
Thanks, Joe. Yes, I keep reminding myself to live an enjoyable life now. I’m very happy with our savings rate too, so it seems like a win-win.
Nice post. I enjoy marathon running myself. I’m doing my third half at the OKC marathon this spring. Hoping to beat my 2:10 PR!
Nice comparison to finances. It’s hard to not to get self conscious with fitness and finances since for some reason flashy seems like that way to compare.
Val and I are working on our savings rate and hit a little over 50%. I feel like I wanna push to about 60% but honestly the diminishing returns for us isn’t worth it until I separate from the Air Force. Gotta constantly remind myself its not a race!
Cheers!
Thanks, Jeff. A 2:10 Marathon is impressive. Nice work. Yeah, I know what you mean by diminishing returns. 50% is still really impressive and the more important thing is figuring out if it aligns with your timeline and goals for the immediate future.
Love the marathon analogy!
As Joe said you two are doing extremely well by saving 50%+ so you should definitely give you guys a huge pat on the back for being already on top of a lot of Americans when it come to owning your life 🙂
For us we started with a 50% SR (growing up in Europe – where the focus on money is quite different – definitely help me personally). 10 years later we ended up at 80% without decreasing our spending. How did we do that? Well as our seniority increased in our jobs, our take home pay increased accordingly. We didn’t get massive promotion or take on more work though as we could have earn even more but the stress would have probably be killing us in the long run.
Which prompt me to ask: where do you see you guys SR being at at the end of this new decade? Won’t your SR meet where ours was by the time 2030 hit?
Thanks Mr. Nomad Numbers. 50% is better than others, but it’s right where we want to be and that’s the important part for us. I’m not sure where our SR will be 10 years from now. It might be much lower as we consider a more independent lifestyle or Coast FI approach where we buy back our time more.
Great post! Its hard not to compare ourselves with others but like you said every situation is different. You have to do what works best for you!
Thanks, Robyn. Absolutely.
Hey if you can do a half marathon you can do a whole marathon. And you should. Half marathons are great, but there is a reason they named them half. I mean it is even in the name of the race. They don’t call a 5K a half 10K do they? Go for the whole enchilada, every runner that is physically capable of a half needs to run at least one whole. If you don’t believe me try to find one person in the world who has finished a marathon that regrets running it. I’ve met thousands of runners, not a single one has ever said, “I wish I had never run a marathon.” But I would bet there are millions of half marathon finishers who regret never running a full marathon.
Thanks, Stevark. That’s an interesting way of thinking about the marathon. You may be right that I wouldn’t regret it, and I may end up doing it one day, but I think I would prefer to spend my time on other hobbies that I enjoy more right now.
Great effort on the marathon, and the savings rate is equally as impressive!
Thanks, Jordan. I appreciate it.
I’ve been known to take things too literally.
I thought this post was going to be about how to save on entrance fees by going out and running typical race distances without registering for a race!
I’ve never formally run a half marathon (and I’ve signed up for 2 this winter and spring), but I have run the distance 3 or 4 times, including once on the same day as Grandma’s Marathon in Duluth, MN along part of the same route (at a different time so I wasn’t interferring).
As a family, we could easily spend more than $1,000 on entry fees in a given year. A better plan for the budget-minded would be to do one or two official races and do others on your own with a GPS watch (which we all have).
Cheers!
-PoF
HA! I need to work on my titles, I guess. Maybe I should write another post about cutting entry fees. 😉
Lots of great points here, Corey. One thing stuck out to me: your comments about net worth, average net worth, etc. I’m right there with you–for so many people, it’s just not high enough.
I’m about to publish a post about net worth, and I was pretty sullen after researching the 25th percentile data in the U.S. For all ages, 25th percentile net worth is <$100K…that includes 50, 60, 70 year olds.
I interpret it as, "1 out of 4 adults I know don't have anywhere close to enough $ to retire comfortably." And that's a really unfortunate state of affairs 🙁
Sorry to be a Debbie Downer. But Stockdale would tell us that the stark reality is important to face.
Yup, it is worthwhile to understand that everyone needs to save more. Just don’t let that convince you that you are ahead/behind the others and get you off track from your goals.
I truly thought this post was going to be about setting up your own road race and literally running it by yourself – that’s my old runner brain acting up!
haha – you’re not the first person to say that. I guess I need to work on more descriptive titles. Thanks for stopping by, Kim.